Frequency Envelope
This post is part of a series of notes and exercises for a summer camp on making musical instruments with Arduino and Pure Data.
In this exercise, we will look at shaping a sound wave. Instead of blasting out a fixed frequency cosine wave, we will allow the user to draw with the mouse a profile of the sound’s frequency over time. By the end, we’ll be able to create a variety of sound effects.
Counter
The first thing we need is a counter that marches through time. Pure Data’s line object can help us here.
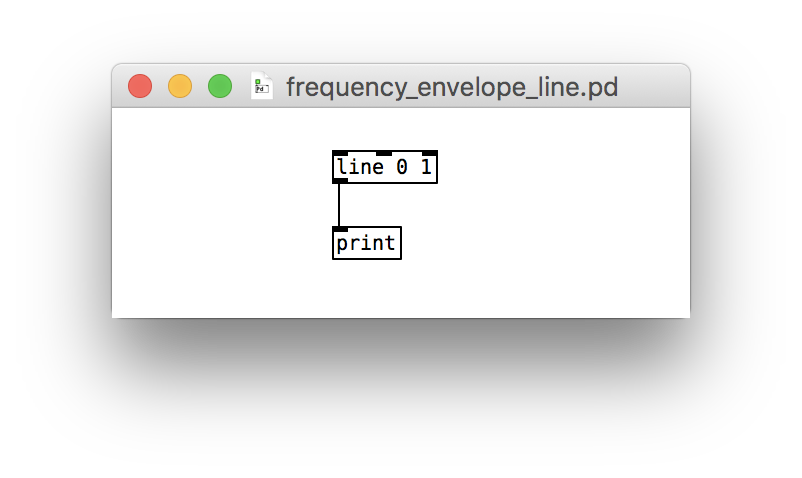
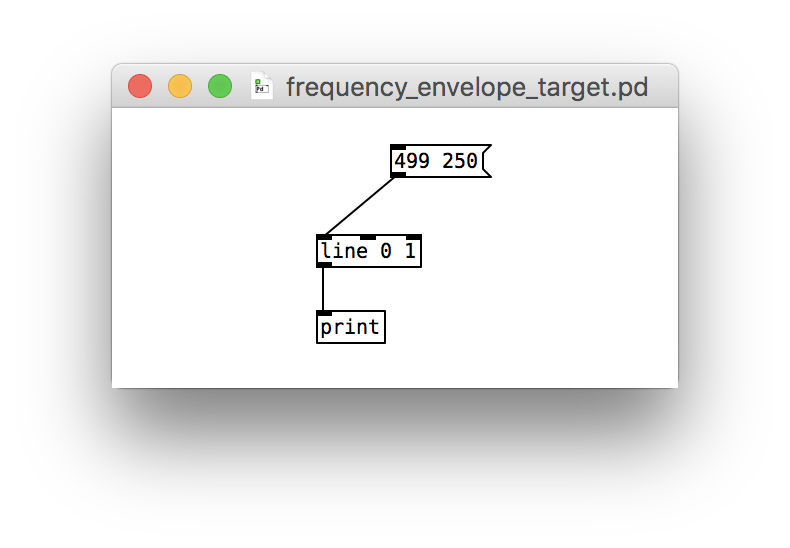
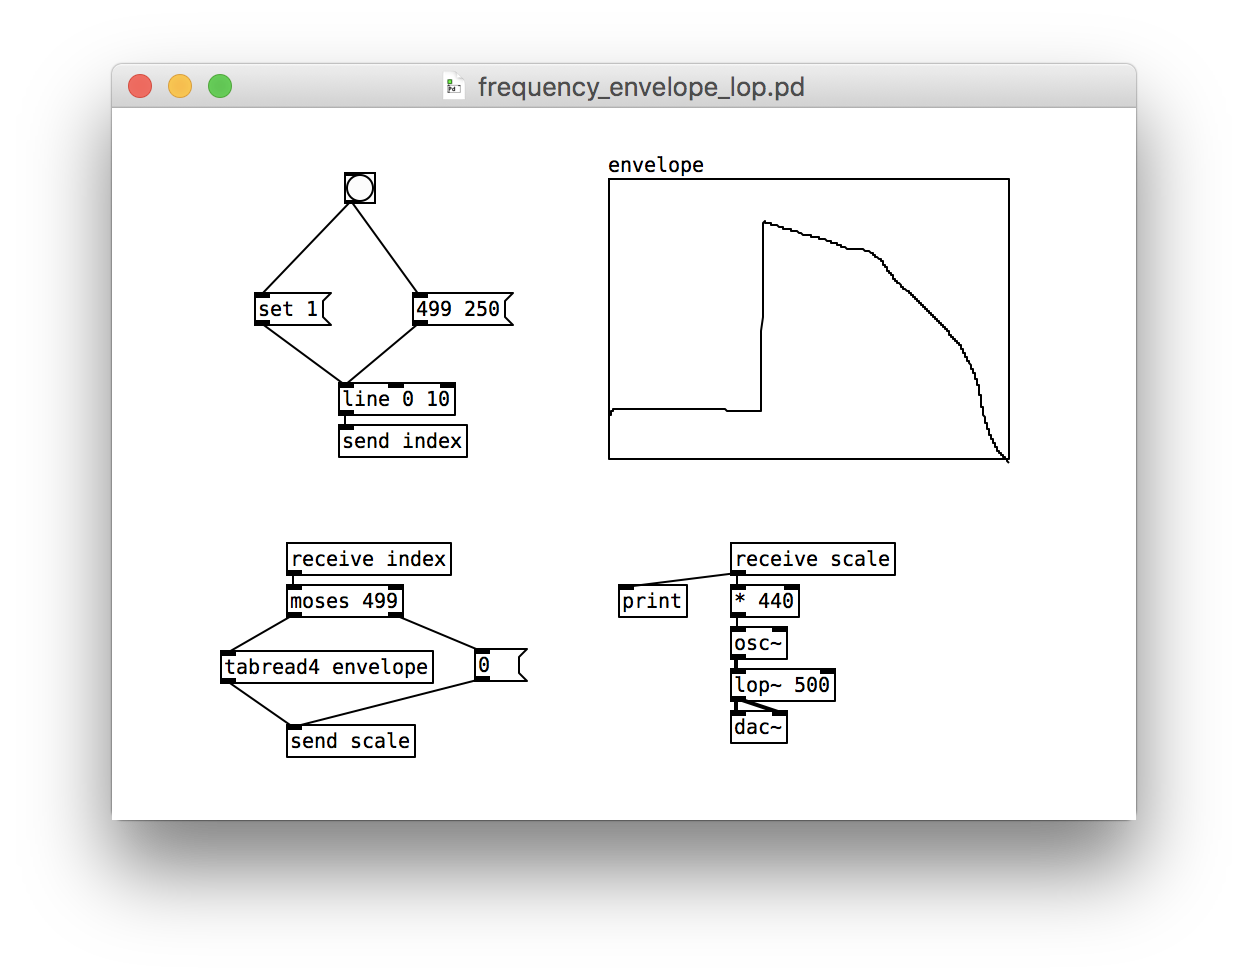
It expects a message containing two numbers: a target value and a number of milliseconds. Here we march to the number 499 in 250 milliseconds:
Click on the message and inspect the Pure Data console to see the numbers.
What numbers do you see and why?Try switching line 0 1 to line 0 10 and click on the message again.
line object remembers where it’s at. It ended at 499 after your first click and it stayed there. To get it to start back at 1, aim a set 1 message at its left inlet:
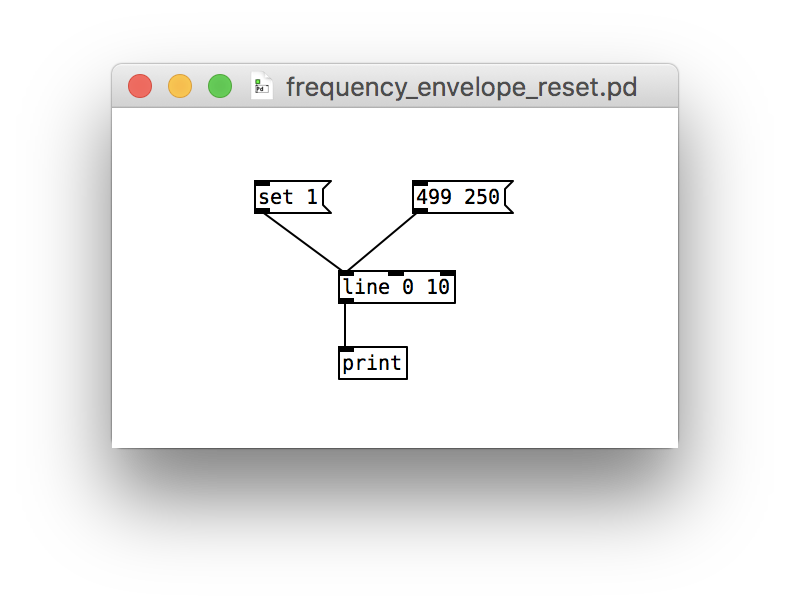
Now fire off both the reset and march messages.
What numbers do you see now?To make it a bit easier to fire off both messages in succession, add a bng that triggers them in sequence:
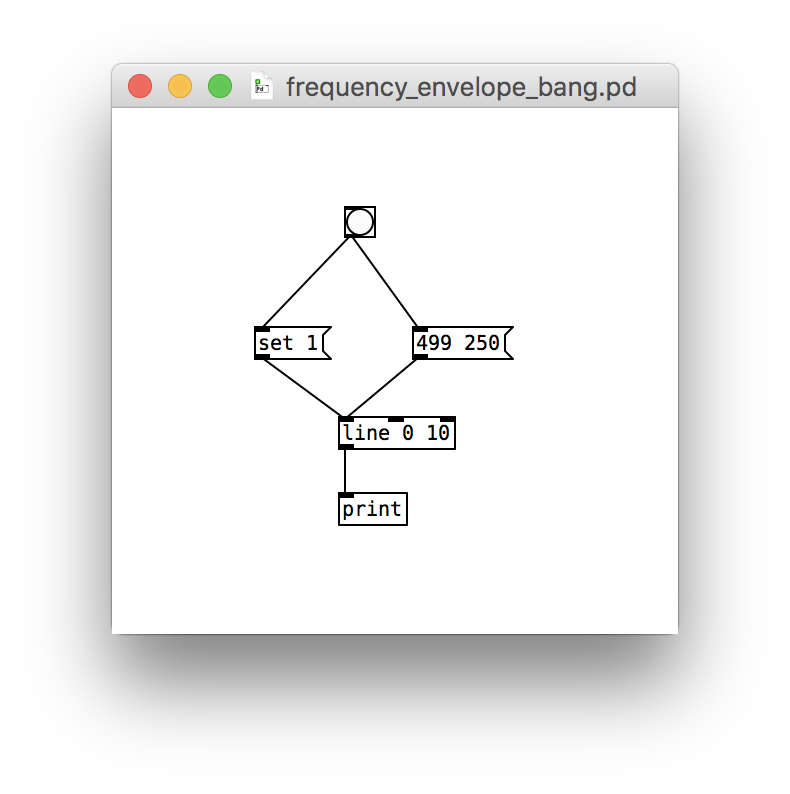
Be sure to wire up the set 1 first. Pure Data activates outlets in the order they are connected.
We have a counter! Go ahead and switch back to line 0 1 and let’s get the user drawing a sound profile.
Envelope
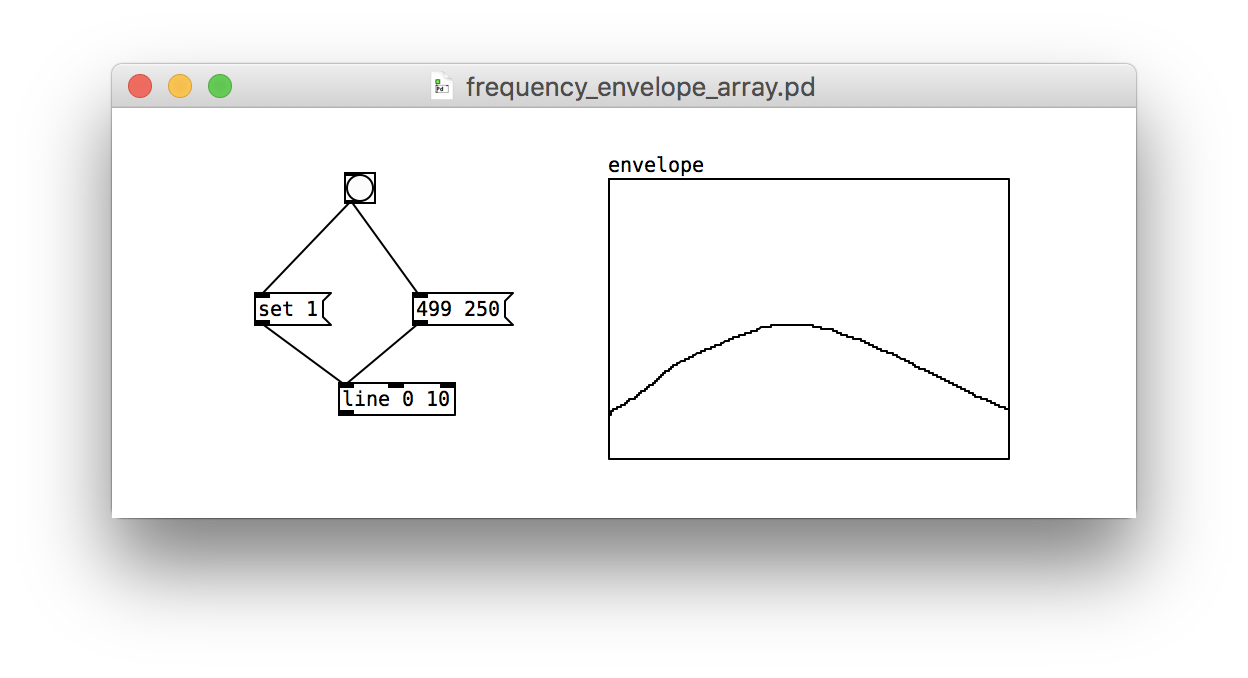
In music, an envelope is describes how a sound changes over time. Envelopes often describe how a note’s volume changes over time, but we will create a frequency envelope to produce our sound effects.
Add a new array with name envelope and size 500 to your patch. Ensure that Save contents is checked. Draw it as a Bezier curve. Leave Edit Mode and draw on the array with the mouse.
We will consider each element of the array to be a proportion or scale of an arbitrarily chosen frequency of 440. When you draw on the array, you are scaling the frequency over time.
By default, the array spans the range 1 at the top to -1 at the bottom. This isn’t a very useful range for proportions. Right-click on the array and set the Y range of the canvas properties to go from 10 to 0.
Your patch should look something like this:
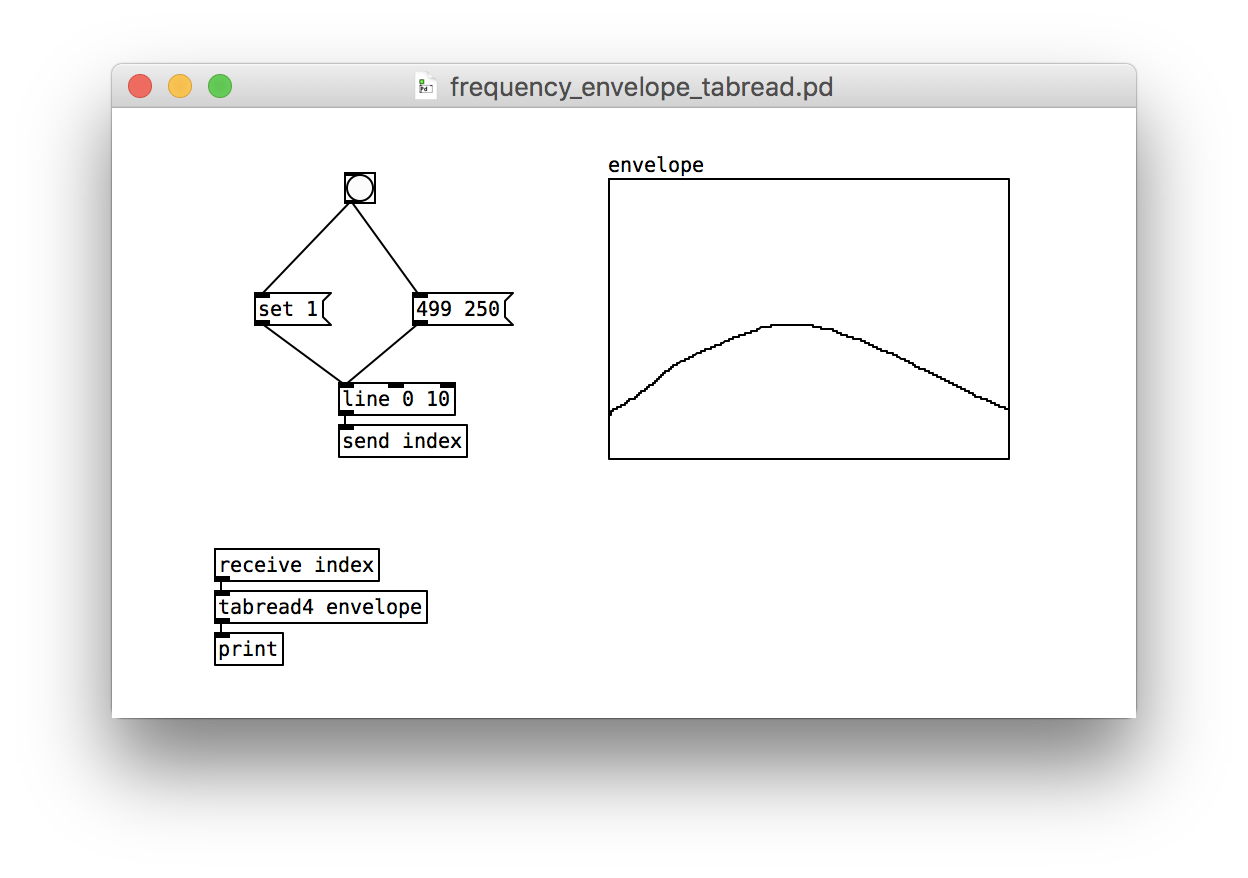
Indexing
We will now use our line to walk through our array and pull out the scale factors over time. A counter that is used to access an array is called an index.
Pure Data patches can quickly become hard to read and understand as they gain new nodes and edges. One way to keep them understandable is to group small chunks of self-contained boxes together in unconnected islands. When one island needs to talk to another, we send data between them using the send and receive commands.
Our line code is self-contained, so let’s keep it as its own island. It will send out the index. Another island that we’re about to raise from the sea will receive it:
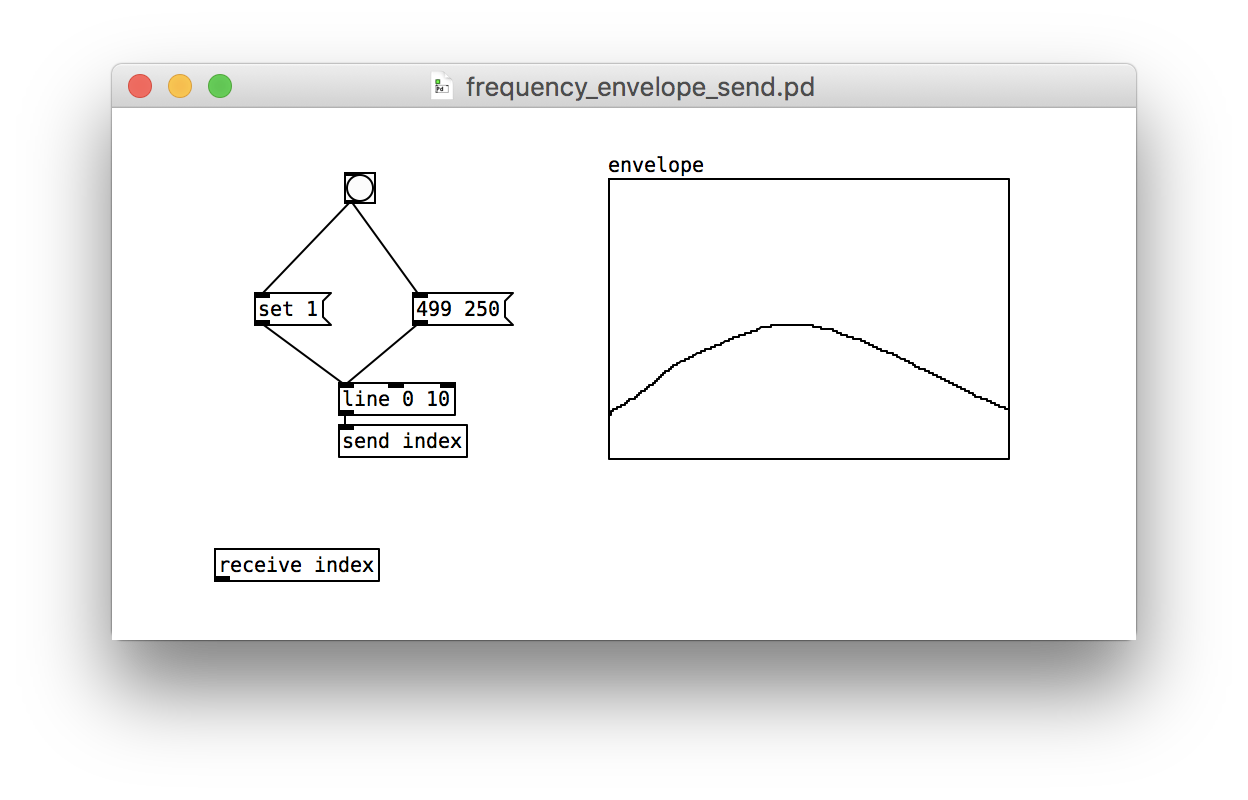
Our new island receives the index and uses it to pull out the scale factor from the envelope using the tabread4 object:
Emitting
With the scale values in hand, we can compute the frequency by scaling 440 and feeding it into an osc~. Let’s make a brand new island for this:
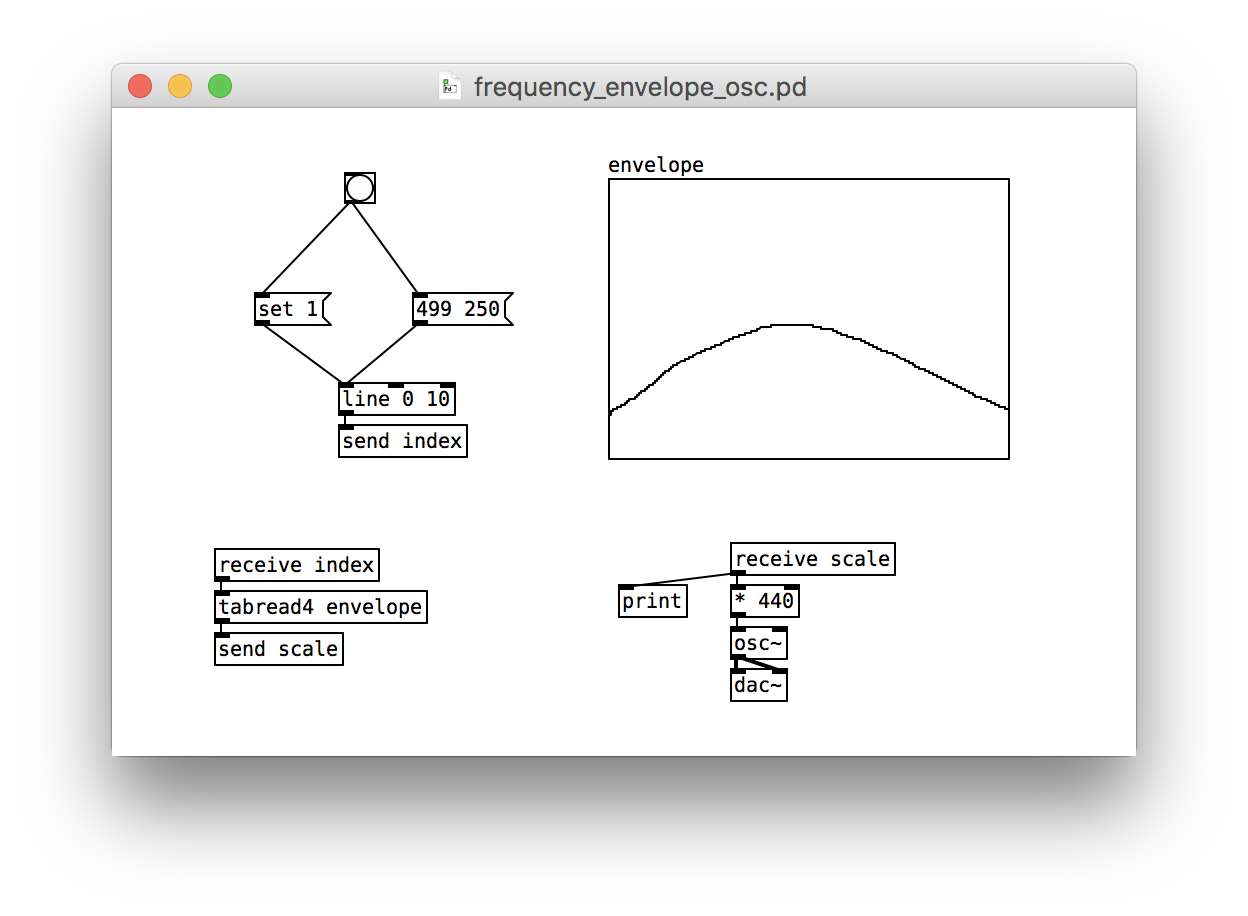
osc~ is now stuck there. One way to get the oscillator to stop after we reach the end of our array is to send along a scale of 0, which will flatten the sound wave.
To get the patch to do something different when we reach index 499, we need a conditional statement. Pure Data has several. The simplest one is moses. It expects a threshold value. If we say moses 50, then all numbers less than 50 get sent out the left outlet, all numbers greater than or equal to 50 get sent out the right outlet.
In our case, we want to issue the scale from the envelope when the index is less than 499, and we want to issue a scale of 0 otherwise. We add this branching behavior to our second island like this:

Filtering
Since we are drawing the frequency envelope by hand, the change in frequency isn’t always smooth. Abrupt changes can lead to an audible clicking. A common way to smooth out a signal and thereby remove the clicking is to apply a low-pass filter. It’s called low-pass because it keeps only low-frequency changes. Let’s sneak in a lop~ 500 after the oscillator, which will smooth out frequencies above 500:
Challenges
After you get your patch working, experiment with different envelopes, durations, and Y ranges. Can you replicate any sounds you’ve heard before?