Seeing Waveforms
This post is part of a series of notes and exercises for a summer camp on making musical instruments with Arduino and Pure Data.
Author Christopher Paul Curtis writes in Elijah of Buxton, “Believe some to none of what you hear and only half of what you see.” The intended target of Curtis’ wisdom is gossip and related sociological issues, but we can apply it to physical sound as well. Our ears are easily tricked, and sometimes we need to see sound to make sense of it.
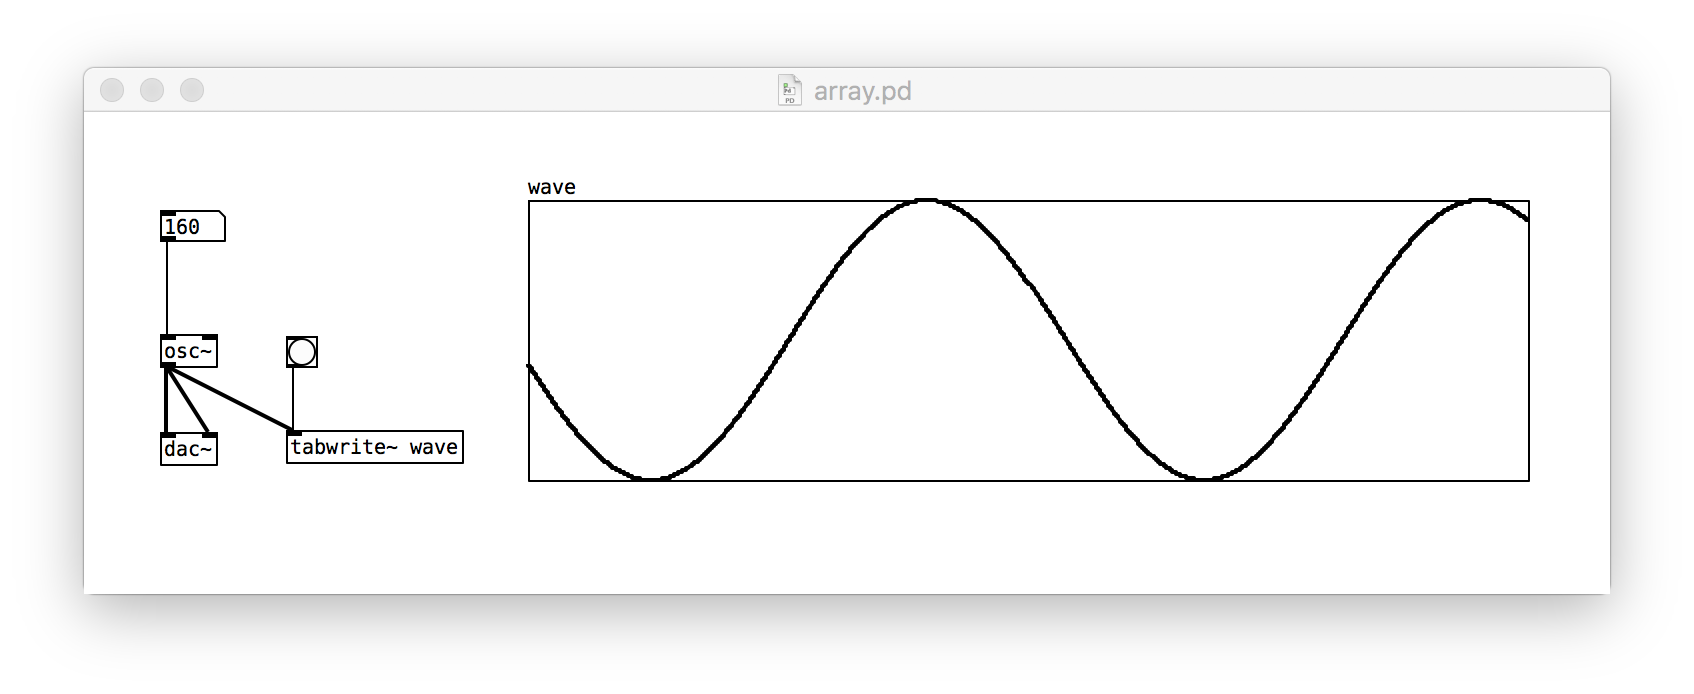
In this exercise, we will visualize the waveforms of pure frequencies using Pure Data’s array object. In particular, we will create a patch that looks like this:
An array is two things in Pure Data. First, it is a container that stores many numbers. Second, it is a graph of those many numbers.
Follow these steps to produce your patch:
- Create a new Pd patch. Click File / New.
- Notice the left three widgets are exactly the same as the ones in the oscillator that we made earlier. Either recreate them or copy and paste in this new patch.
- Add a plot to the window. Click Put / Array. In the dialog that pops up, configure the array as follows:
- Name the array
wave. - Set its size to 500.
- Uncheck Save Contents.
- Name the array
- Widen the plot. Two-finger-click or right-click on the array’s box, and in the Canvas Properties window, change the size to 500.
- Record the soundwave’s amplitudes in the array. Use Put / Object to add a
tabwrite~object. This command is an abbreviation of table write. Write to thewavearray by typingtabwrite~ wavein the object box. This expression passeswaveas a parameter. - Connect the outlet of
osc~to the inlet oftabwrite~. - Leave Edit Mode and generate some sounds. What do they look like? Probably you aren’t seeing anything. That’s because we’re only storing numbers in the array; we aren’t plotting them.
- Plot the array. Use Put / Object to add a
bngobject. This command is an abbreviation for bang. Iftabwrite~is given a number, it stores it. If it’s given abng, it plots the numbers it has stored. - Connect the outlet of
bngto the inlet oftabwrite~. Leave Edit Mode and generate a sound. Click thebngto view the waveform. - Change the frequency, click the
bng, and observe how the waveform changes.
Challenges
After you get your patch working, answer the following questions on a piece of scratch paper.
- How does the waveform change as the frequency changes?
- How can you tweak the patch so that every time you change the frequency the plot automatically updates?
- Imagine a cement wall. Imagine a high frequency sound wave being directed at the wall. Then, imagine a low frequency wave being directed at the wall. Based on the waveforms you’ve visualized, what do you expect will happen to the two waves?